
Role: UI/UX Designer
What are Sustainable Development Goals?
The Sustainable Development Goals are a collection of 17 interlinked global goals to create a more sustainable future for all people. Established in 2015 by the United Nations and is intended to be achieved by 2030. Each goal individually hones in on a particular problem around the world.

What is Sustainable Tracker?
Our client presented our team with a comprehensive problem: she found that the current means of portraying the progress of global sustainability usually focused on individual project results rather than progress as a whole. As such, she desired her website sustainabletracker.com to encapsulate the sustainable development goals as a whole while improving the visualization of the website in order to bring more attention to SDGs.

Problem Statement
Sustainable Tracker needs to revamp its website because the client’s goal to promote and fund SDGs through a centralized website is, at the moment, too difficult to realize with the lack of proper information, visual graphics, and aesthetic design. (https://www.ncbi.nlm.nih.gov/pmc/articles/PMC4863498/). As a team, we needed to create and incorporate visualizations and heat maps of events related to UN SDGs for promotion on social media in a feasible yet engaging and memorable manner. Furthermore, design a centralized hub where different leaders of the SDGs can come together and collaborate.
Background and Context
The problem lies in the minimal outreach that the Sustainable Development Goals are producing, in particular, in the specific website that we are seeking to improve. The SDGs contain many different advocates and leaders throughout the world, however, there are multiple forums that these leaders participate in and not a centralized media that is utilized to its fullest. That being said, due to the scattered and disunified nature of the SDGs, the overall impact diminishes. (https://sdgs.un.org/goals)
The sustainable development goals were implemented in order to educate the public, promote projects that aim to better the community and measure the progress that has been made thus far. The official SDGs website states that “the United Nations Sustainable Development Goals (SDGs) are targets for global development adopted in September 2015, set to be achieved by 2030. All countries of the world have agreed to work towards achieving these goals”. (https://sdg-tracker.org/ ) This website also serves as a database to get a better understanding of the progress being made through statistics. There are 17 global goals on which the SDGs focus. These categories include social, economic, environmental, and educational issues. However, this website is not the sole resource that the SDGs have, in fact, there are many other websites that project leaders use to further their individual projects that ultimately have similar goals to one another. One such example of an unaffiliated group working towards the same goal is the Innovations for Poverty Action, acting in Africa and Asia. (https://www.poverty-action.org/).


Goals and Objectives
As a team, we will be promoting awareness and engagement toward the United Nations Sustainable Development Goals (SDG) through the development of an interactive dashboard that will deliver the necessary information to understand the SDG at hand. The interactive dashboard will contain a combination of graphics that will showcase the most relevant statistics and information with regard to the SDG. The dashboard will also contain heatmaps and data charts that will inform where progress has been made to achieve the goal of the specific SDG.
Our SMART design:
Specific - Creating an interactive dashboard that will display the necessary information with regards to SDG 1 “No Poverty.”
Measurable - User testing to obtain feedback on what sections of the dashboard demonstrate to work well and which parts seem to lack the effect wanted.
Attainable - Interactive prototype via Figma.
Relevant - Raising awareness, promoting engagement for people who could be interested in helping and learning more about the SDGs.
Time-bound - December 2, 2021
Approach
We approached the problem at hand using an evaluation of the current website, and believe that the best way to reach our client’s goal was to design an interactive dashboard that would display the information for the specific SDG. We gathered data from different websites that gave statistics and information with regards to the SDGs, the data was then separated into different categories according to what targets it addressed. In order to reach our final approach, we brainstormed ideas and separated them based on what approaches seemed to be the most accurate and reasonable for the time we had. Through our liaison, we were able to interview our client to make sure the design/approach met her expectations, we also updated our client with the latest additions we had done through our meetings. Our team utilized Google Drive to store all the documentation we did for the project and used Gantt charts to track the progress of the project.
The major phases in our project were planning the approach, research, iteration on the construction of the dashboard, and communication with our client. Our planning for the approach was done through our class meetings and outside resources where we met with our group either by zoom or in the group chat. The research made on SDG1 was based on the websites that were given to us by both our professor and client, it was through them that we were able to find the important statistics and information for the specific SDG1. Additionally, research was made on the different programs/organizations that are trying to create progress for disappearing poverty. Throughout the project, our design team has been iteratively designing low, mid, and high fidelity wireframes on how the dashboard should interact. After designing the high-fidelity wireframe, they then went on to prototype the interactive dashboard. In addition, communication with our client was crucial in order to address any concerns had with respect to the dashboard. It was through our client’s feedback that we were able to finish our final product to be delivered.

Schedule
Major Project Phases
Ideation
Meeting(s) with our client - Here we will discuss the challenge her website has encountered. We also discuss any updates done to the solution we’ve designed for.
Affinity mapping - organizing our team’s ideas on what can be done as a solution to the challenge that our client talked with us.
Empathy mapping - mapping responses on the importance of the different stakeholders that could be attracted to the Sustainable tracker website.
Data collection
Find data on SDG 1 including its current goal(s), progress towards each, and quantitative data.
Find information with regards to what organizations, meetings/talks are being done as a response to approaching the goal of SDG1.
Iteration
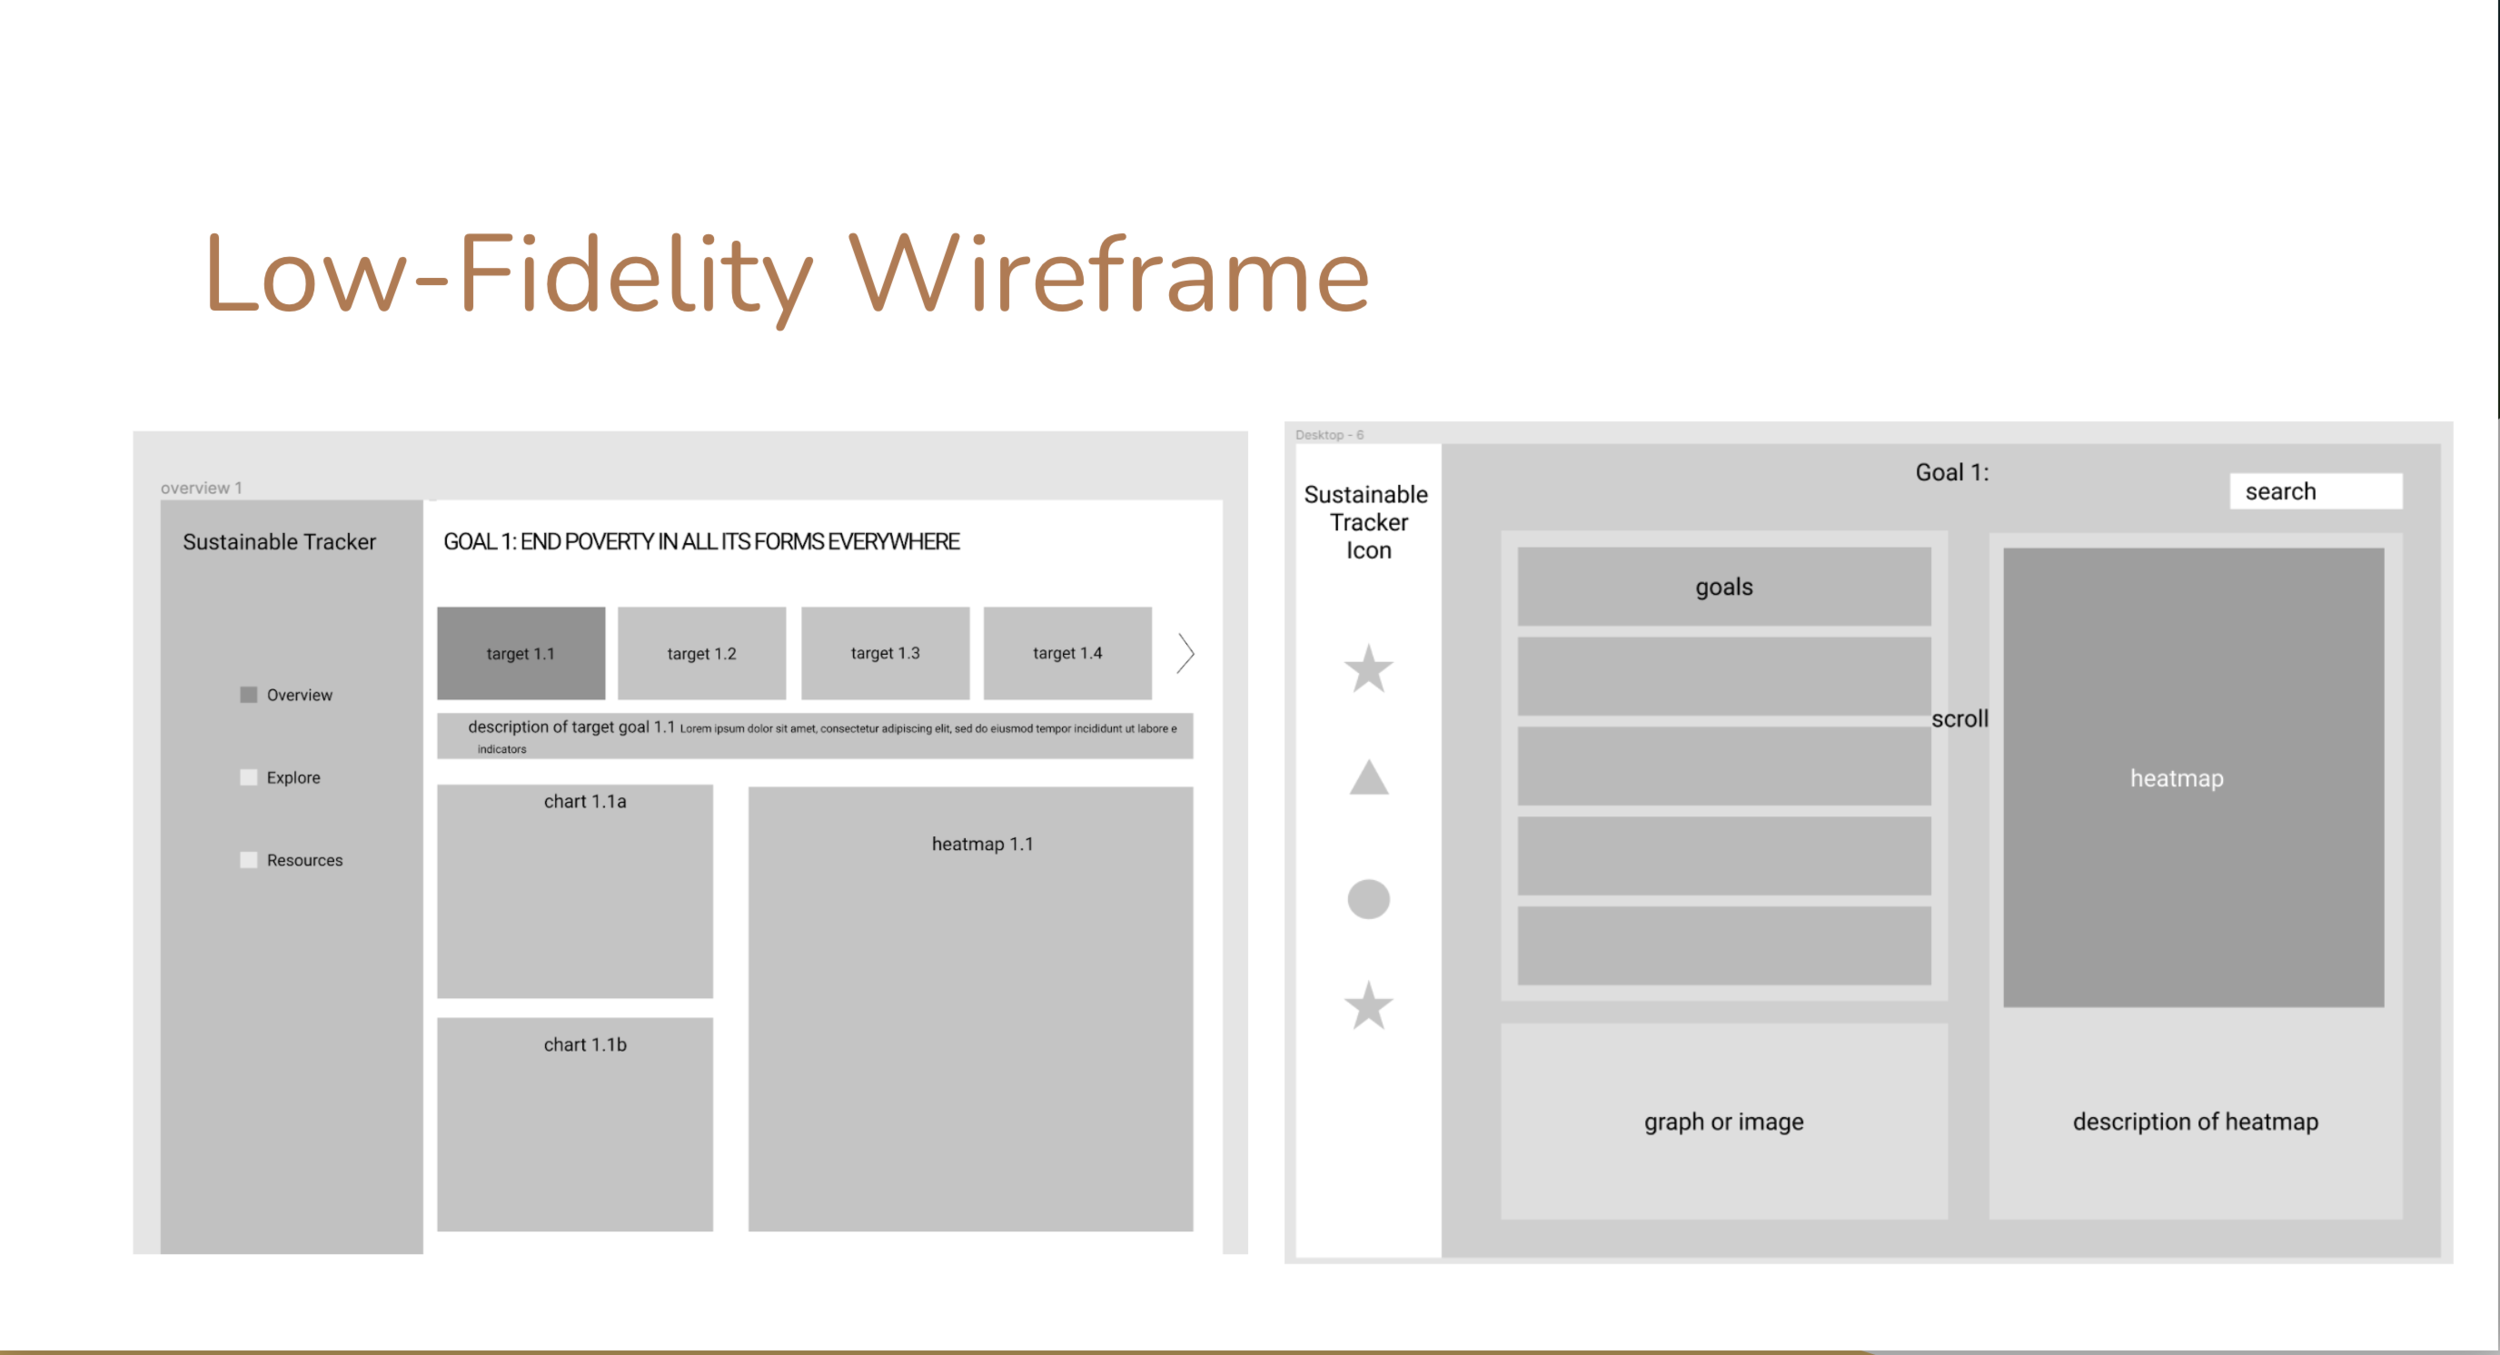
Low fidelity wireframes - hand sketches of possible website layout
Mid fidelity wireframes - Figma ‘sketches’ of website layout along with interactions
High fidelity wireframes - website layout on fFgma with text, images, and color
Prototyping - interactions on Figma. How the interactive dashboard will be interacted with the users.
Communication
User testing - see stakeholder response to interactive dashboard; ask them to perform tasks, think aloud, and note any user confusions
Clientele feedback - meeting with our client in order to get any feedback from the client herself. It is through feedback from our client where we can address her concerns.
Gantt Chart:
https://docs.google.com/spreadsheets/d/1RktpfwuDG3cKLLGVNhWqTte4ZVq7CGmUzIwdxy0YxQI/edit?usp=sharing
Stakeholder Analysis
Our stakeholder analysis displays the importance of different stakeholder groups based on interest and power. As promoters of the sustainable development goals, we have placed social media users and communities in participation of development goals as our primary stakeholders.
Social media users are one of our primary stakeholders as promoters since they have the ability to promote SDG and users of the aimed platform.
Investors have the highest power since they provide the funds for the website/updates on SDG. While they may not be completely invested in every detail, they have the power to keep the information updated.
Governmental Agencies don’t necessarily need to look onto our website to gain information. They would have greater access to more information and a greater personnel.
Countries that are participants in the UN would not need particular access to the information we provide but are rather the providers of such information
Communities that are participants in the developmental goals may want to be featured, promoted, or donated to for the cause of the SDG.
Anyone with an interest in sustainability can apply to anyone who ‘cares’ about the world. They don’t have any power individually but hold the greatest interest within a community.

Personas and Empathy Maps


We did not run any initial user interviews but instead, relied on our client to present the problem for us. In our weekly meetings, she would test our prototype and give us feedback on what she liked and didn’t like.

Initially, we intended to create a dashboard for all 17 Sustainable development goals (SDGs), but instead looked at focusing on one single goal instead and adding news, events, projects, organizations, and publications as opposed to a holistic overview of all SDGs.


Link to Mid-Fidelity Wireframing.

Link to Final Figma Prototype here.
How our solution mitigates the problem?
Problem: To get fully aware of a specific SDG, a user must interact with different websites because you cannot find everything in a single place.
Our interactive dashboard mitigates the problem by offering a complete environment where all the information can be found related to the SDG1.
Engages the user by data storytelling:
Explaining the importance of the SDG1
Enlightening users by the display of graphics and heatmaps
Engages with the user by showing them how they can join and help out
Conclusion
Our Interactive dashboard creates a single place where users can get completely informed of an SDG and is easy to use, we intended to make the dashboard straightforward and simple in order to keep the focus on the information/data.
Future and Next Steps
Possible next iterations of this work are Dashboards for SDG 2-17, promotion and marketing through various social media platforms, and more thorough user testing.

